We'd love to hear from you if you have questions about our products or services.
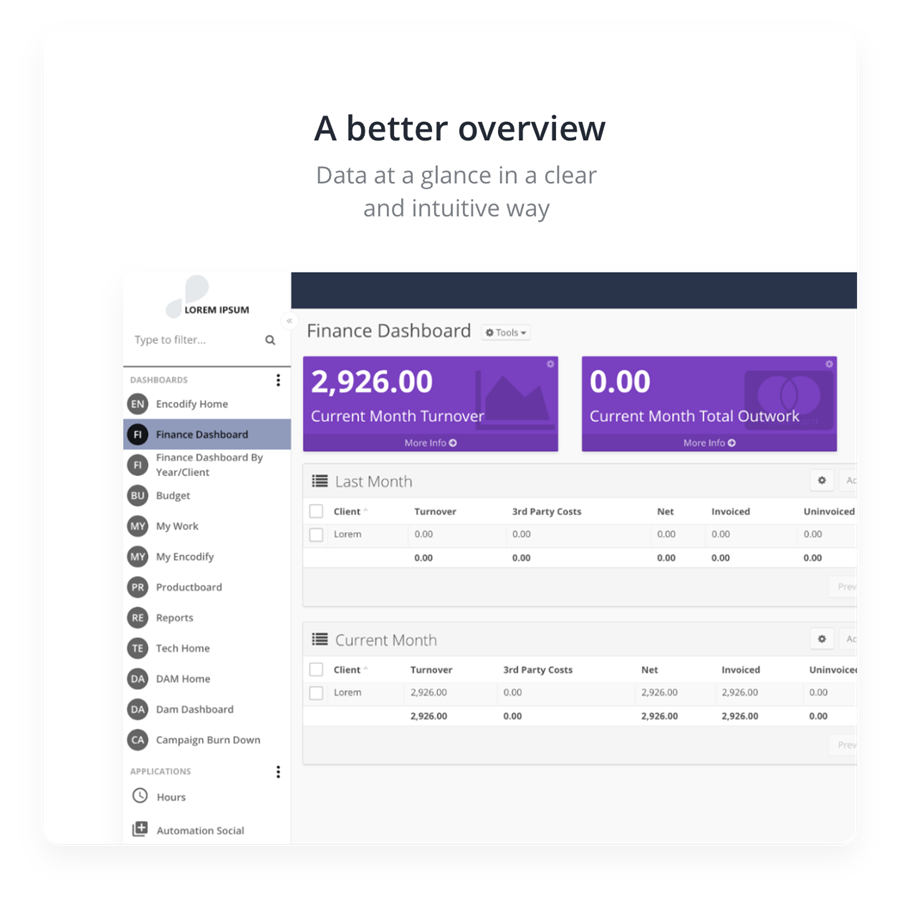
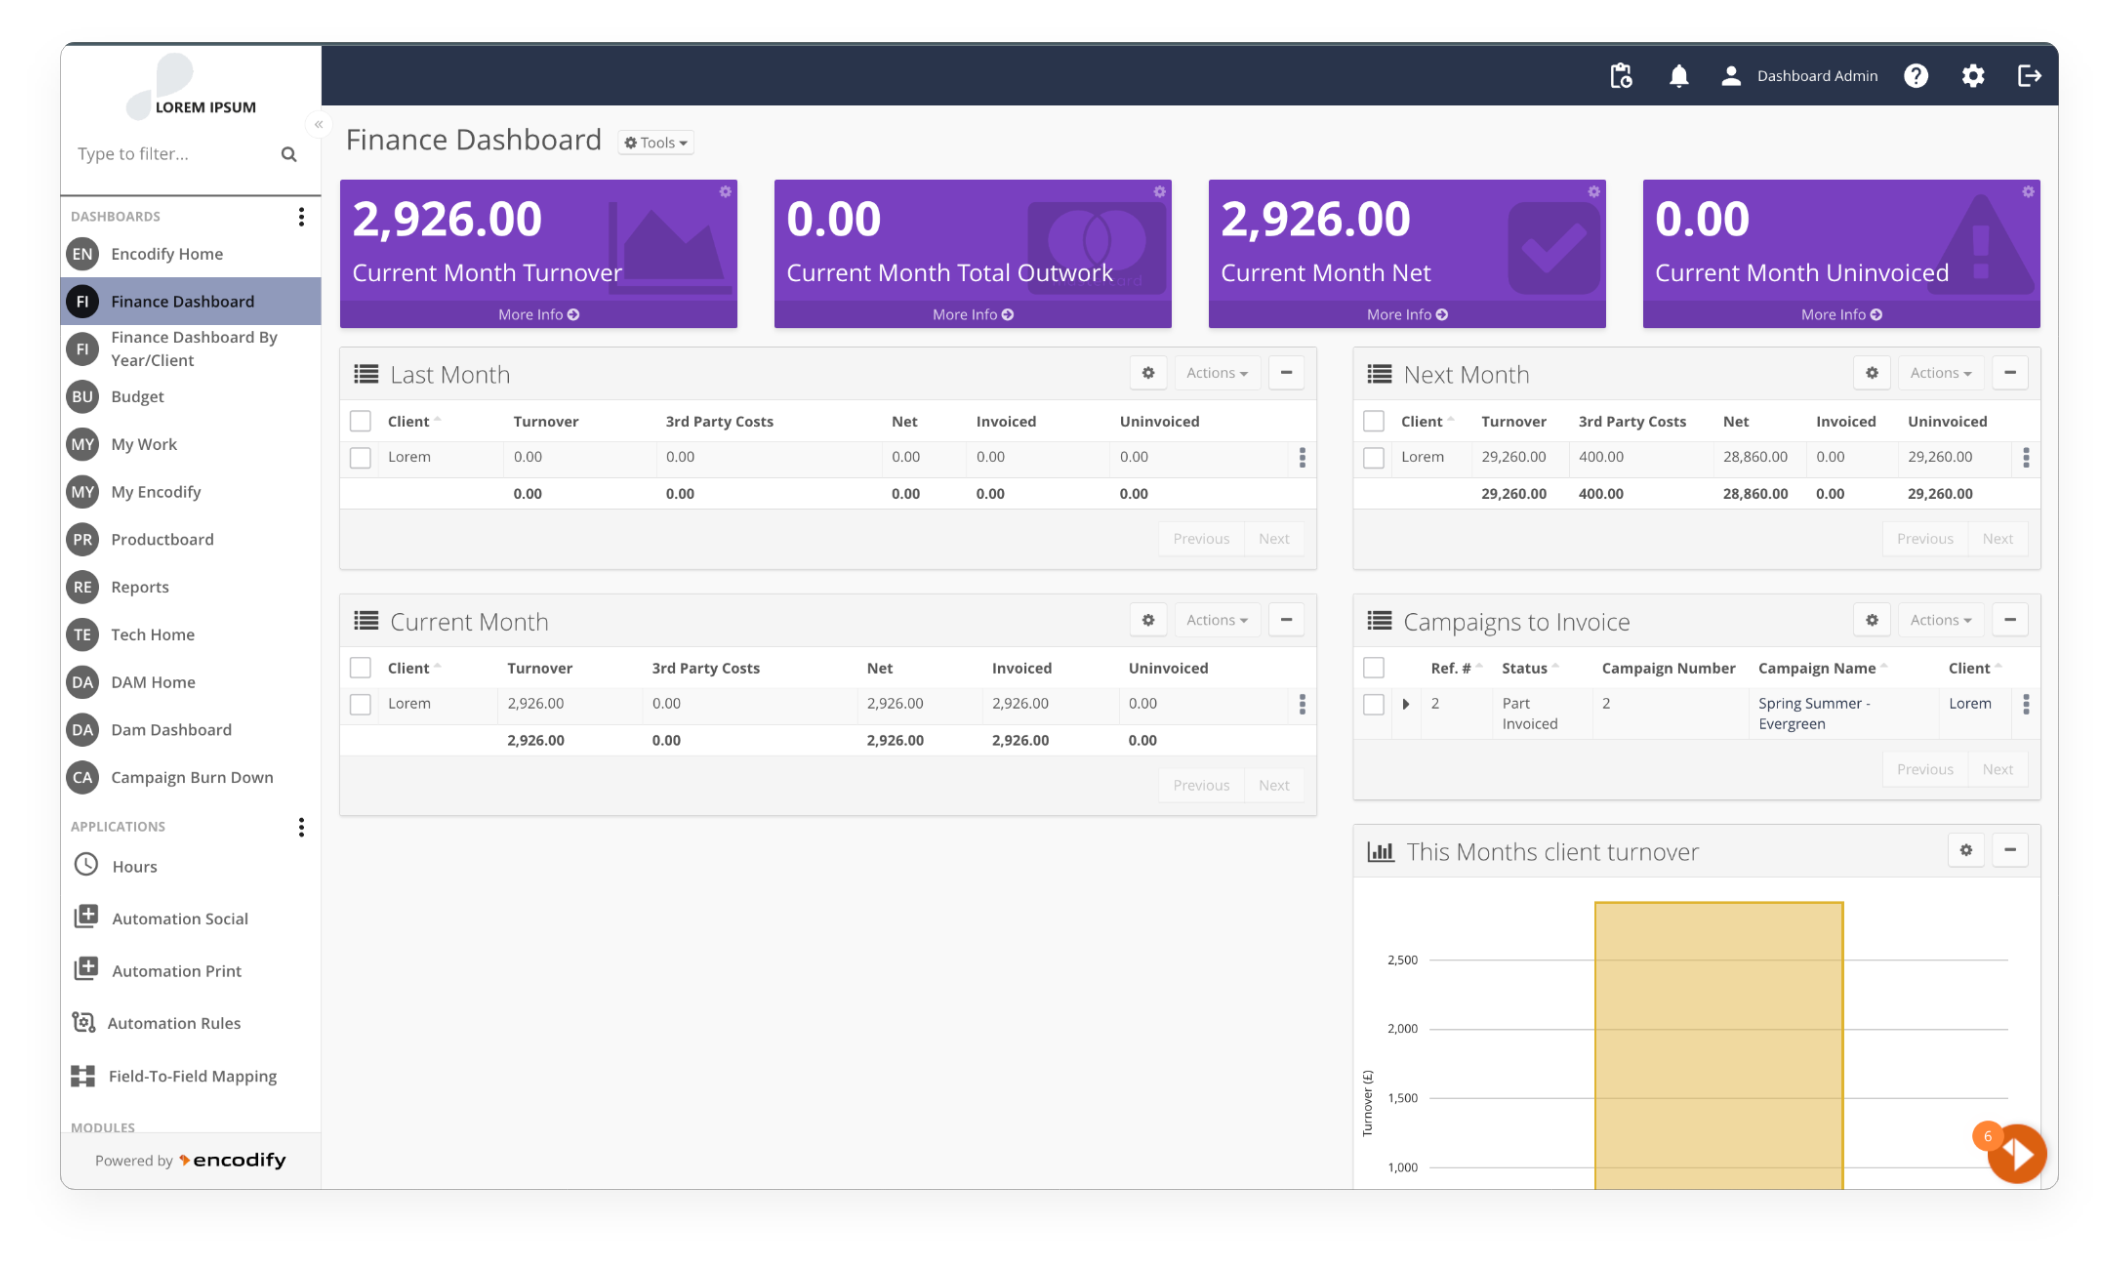
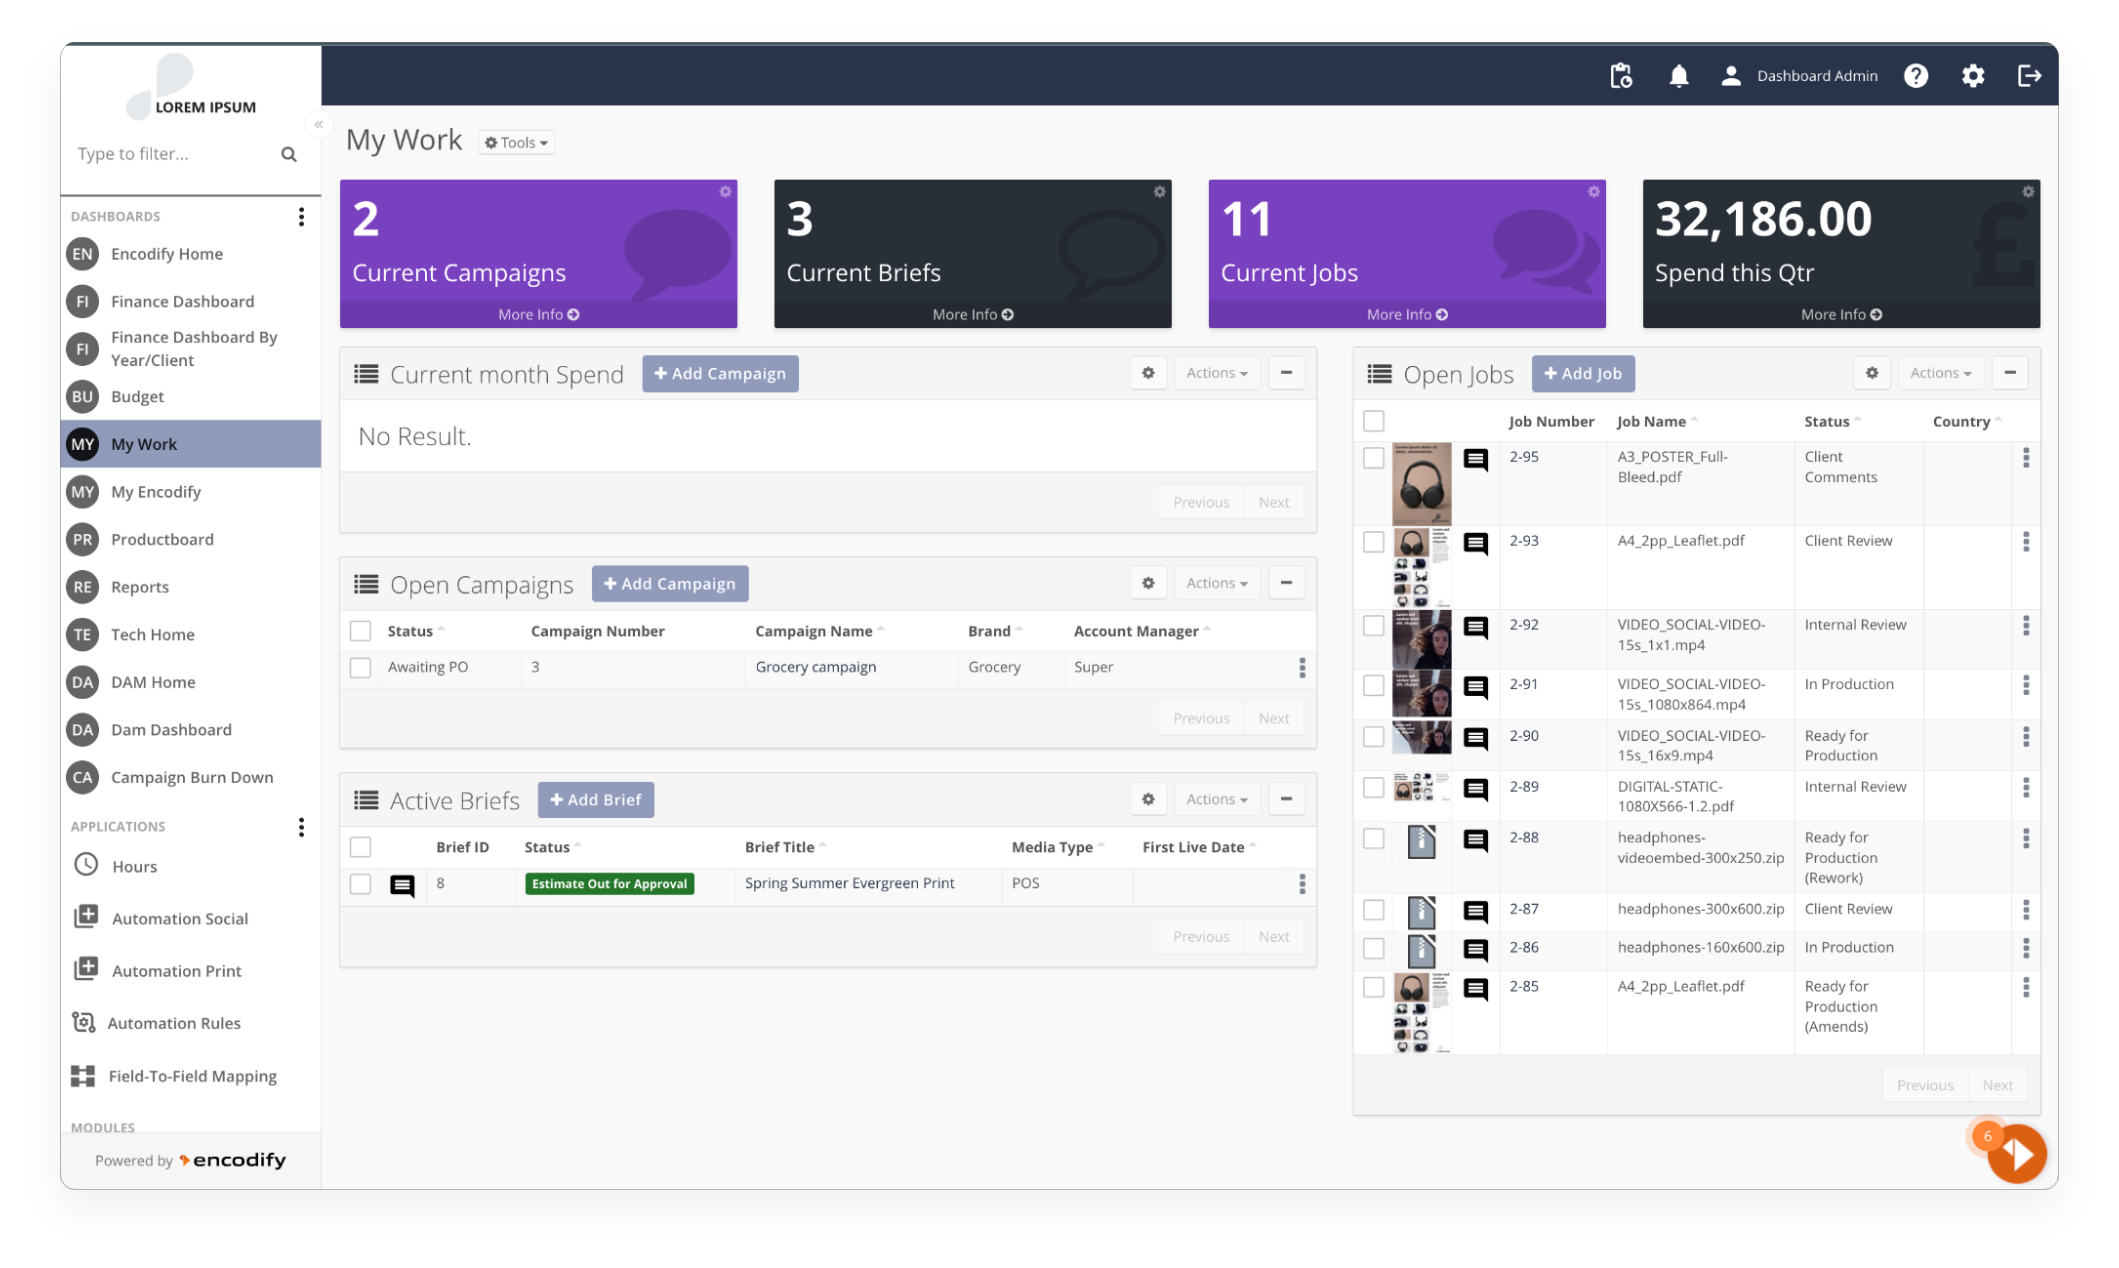
Display key data and metrics allowing you to gain a better overview of work in progress at-a-glance to enhance make decision with confidence
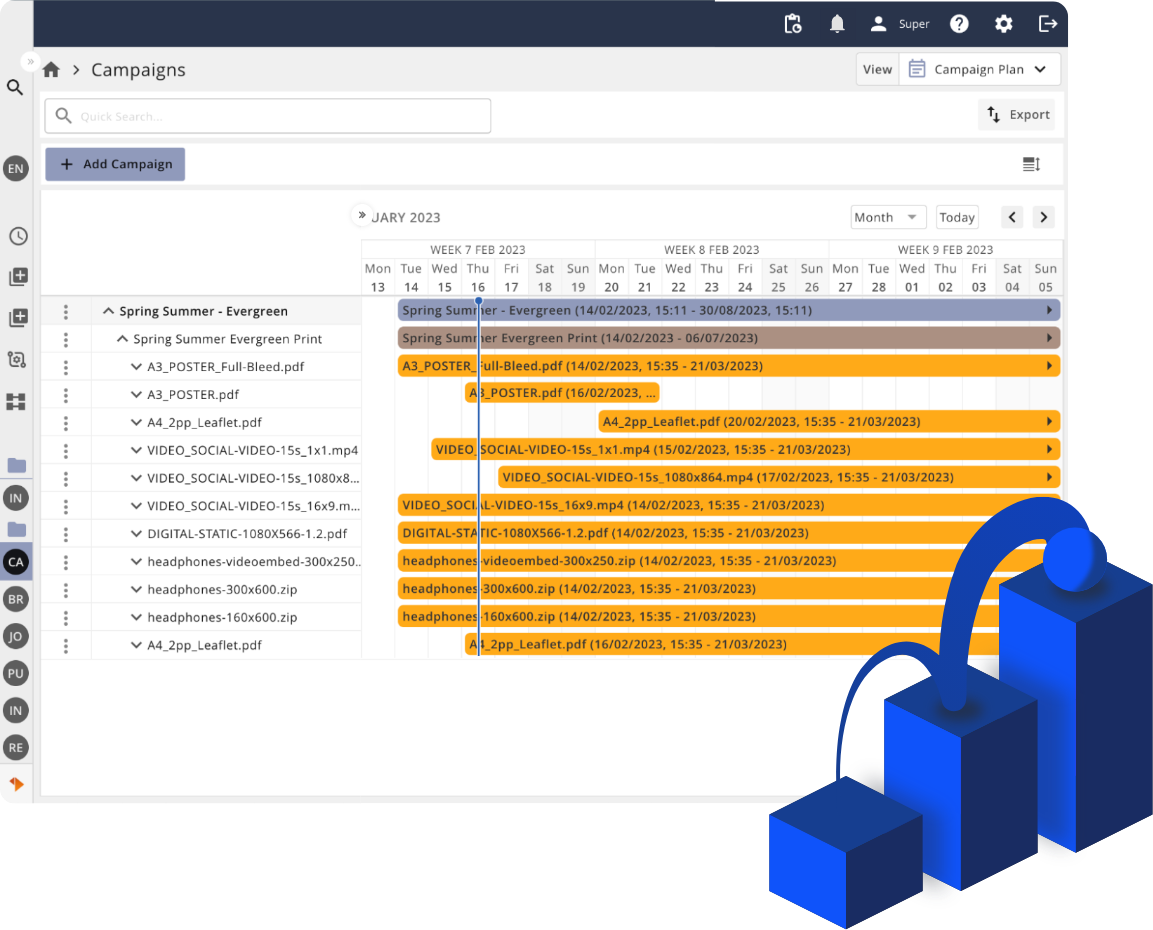
Get a handle on things with the power of Dashboards
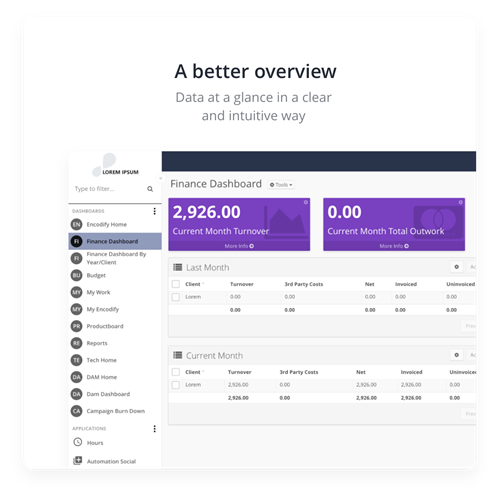
A powerful way to make complex data more accessible and understandable to a wider audience. Easily understand your data at a glance in a clear and intuitive way to empower your teams to make better decisions.
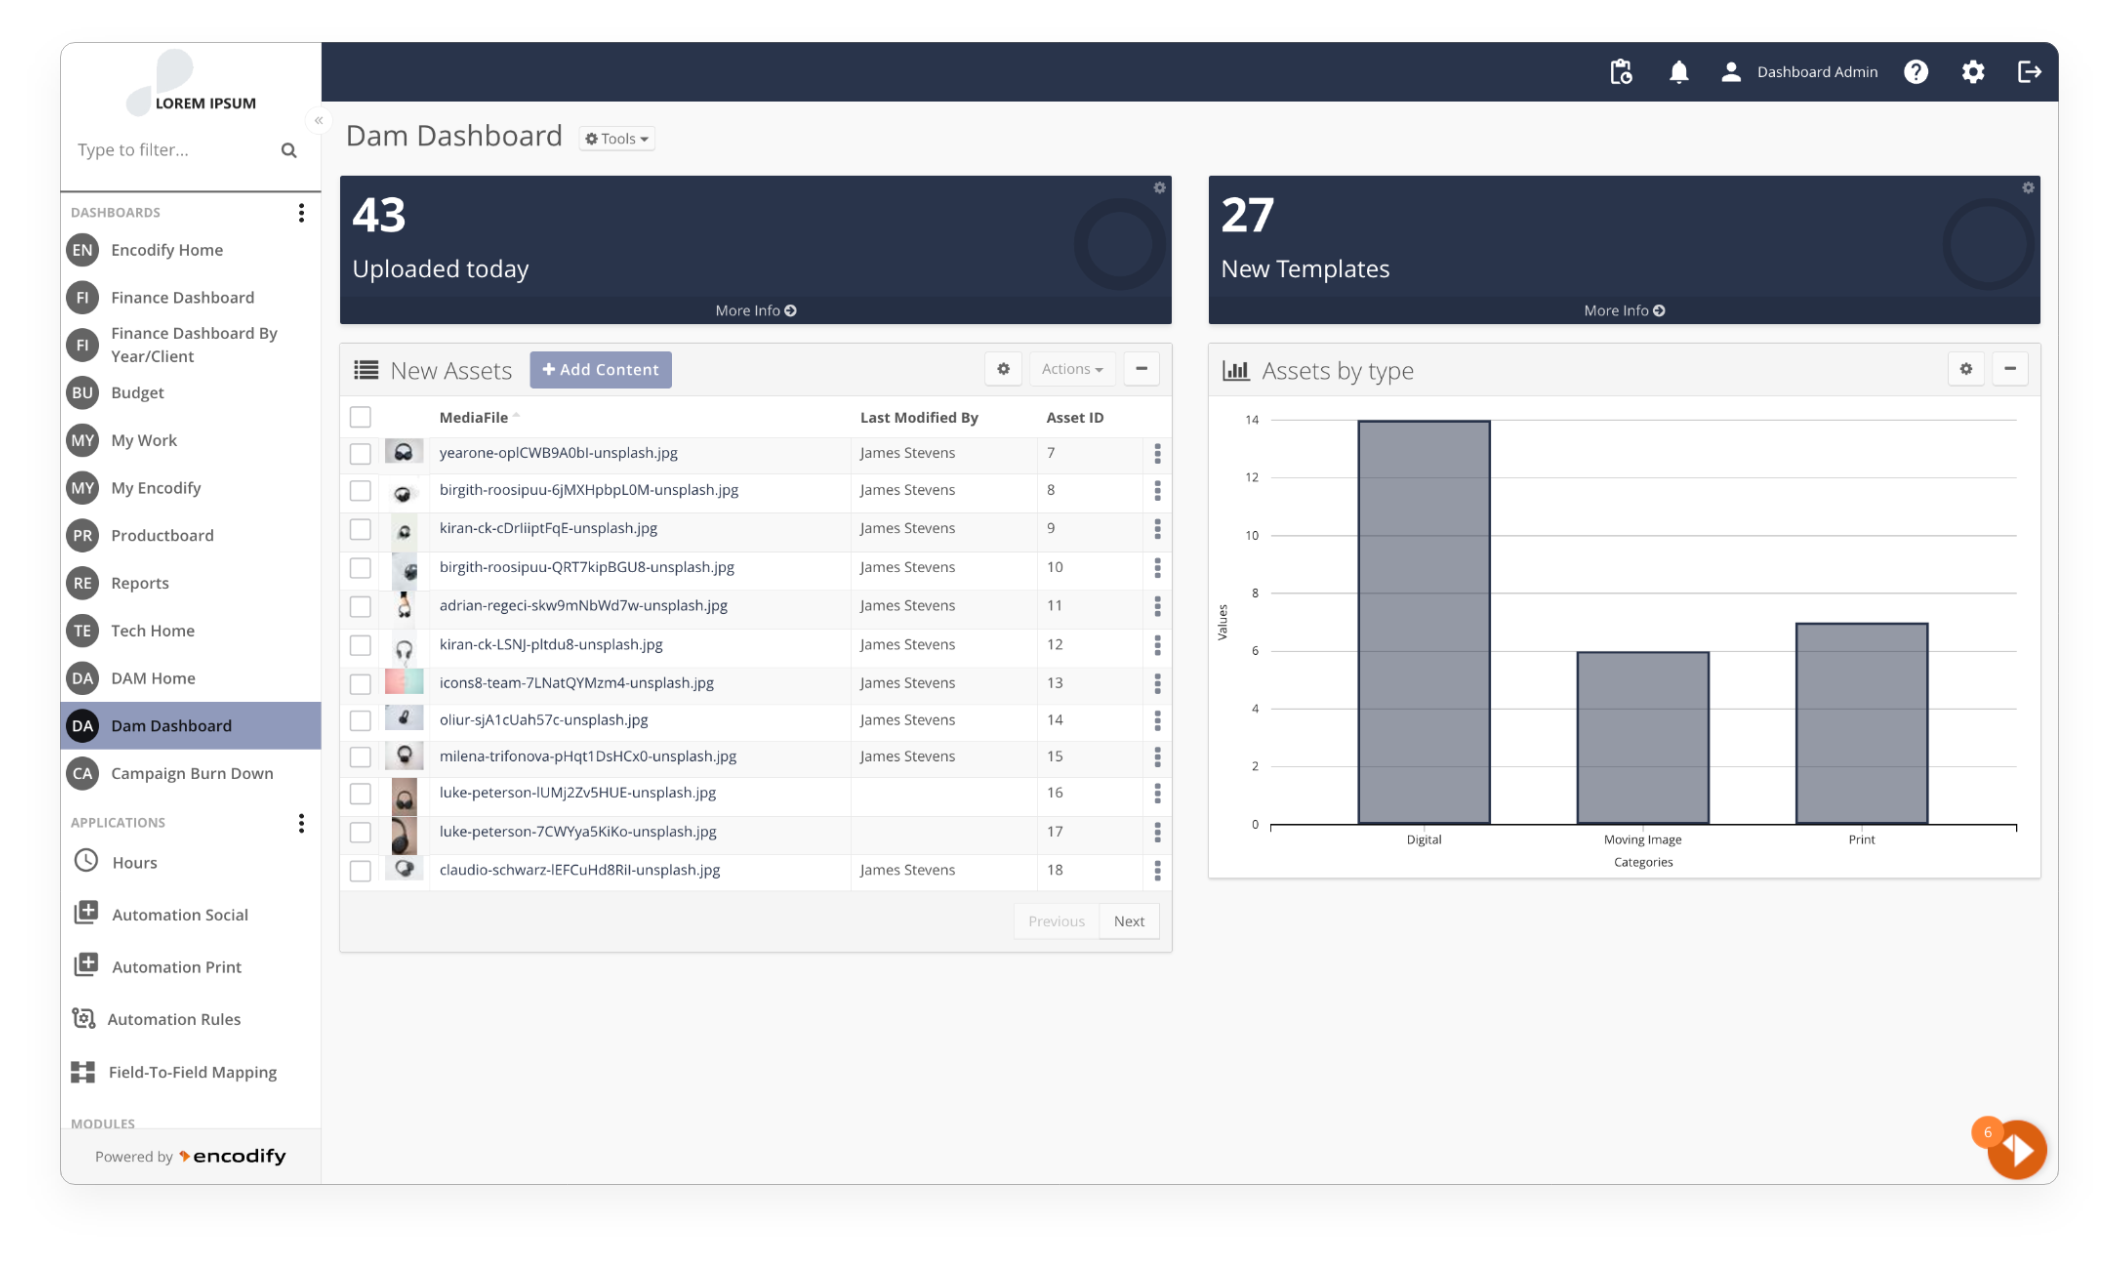
Support for a wide range of widget types including header images, portal cards, charts, views, and more
Filter the results to ensure you see the data that is relevant to you
View key performance metrics and assess risk
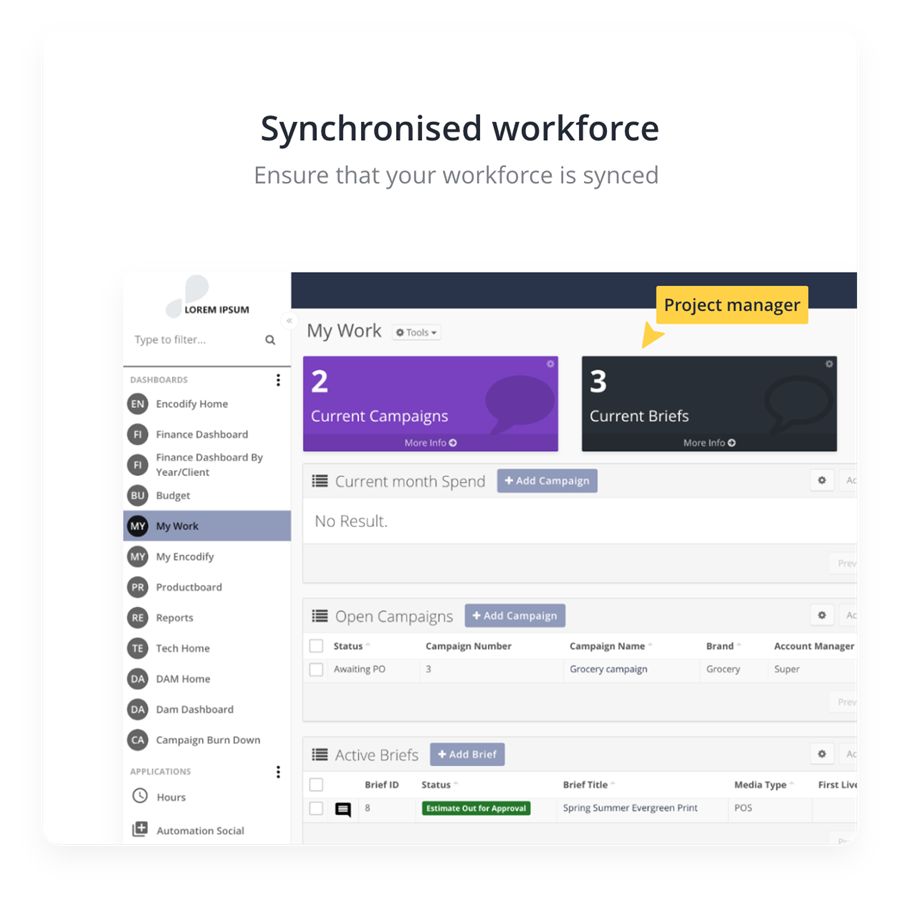
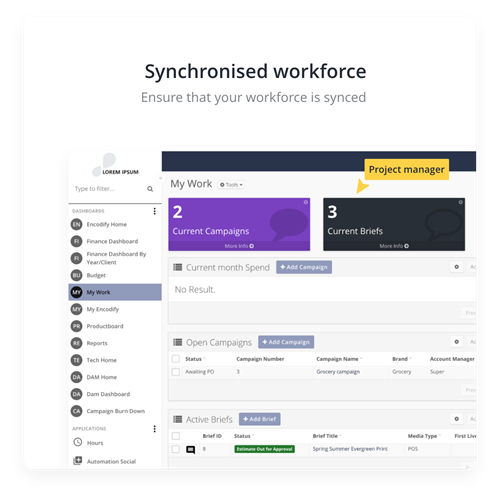
Ensure that your workforce is synced and working towards the same goals - minimise the risk of delays
Prioritise your teams tasks and ensure there are no delays
Share dashboards with your team to ensure complete alignment
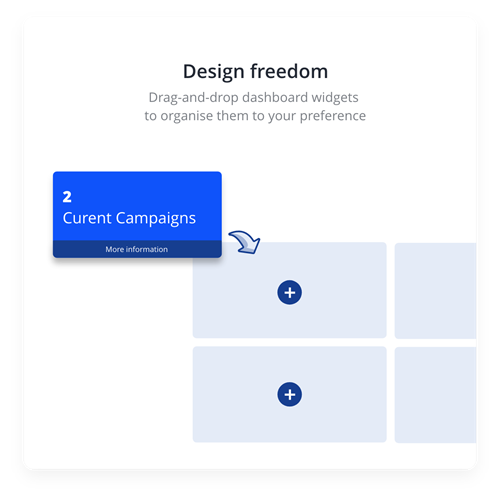
How you view your data can vary depending on the use case, and with Encodify dashboards, there are endless customisation possibilities.
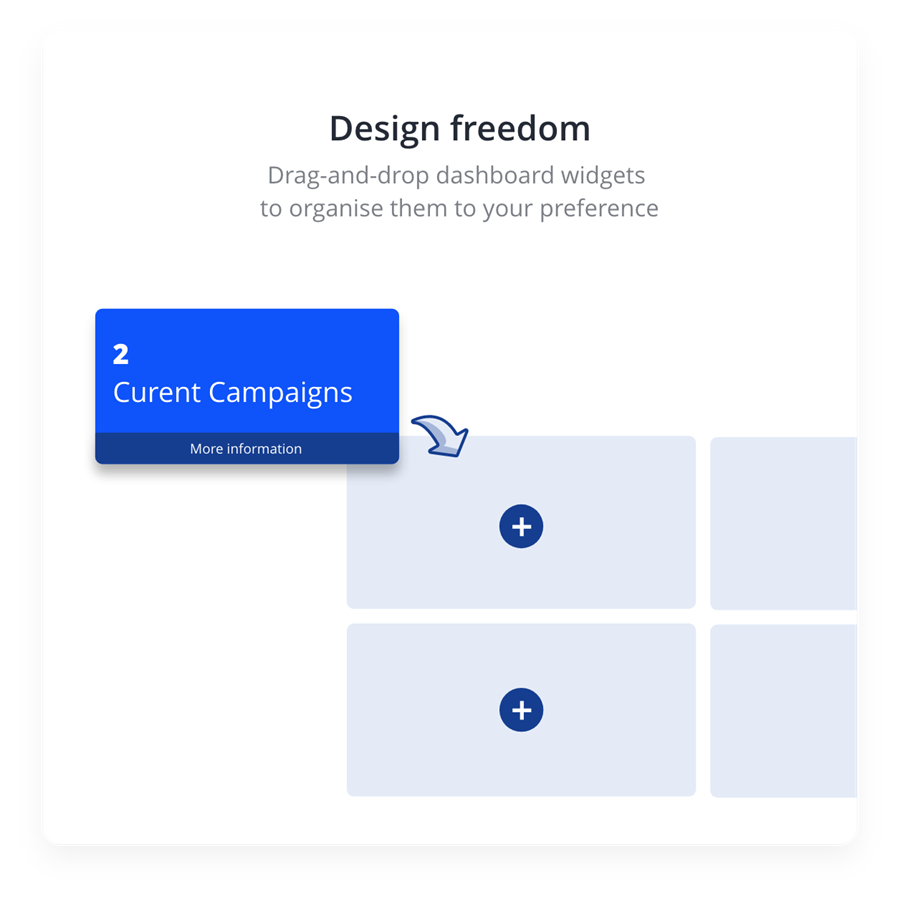
Drag-and-drop dashboard widgets to organise them to your preference
We ensure that you can centralise your data from multiple sources giving you improved visibility as work progresses
We ensure that you can easily identify inefficiencies in business processes and allow teams to gain an overview of the work required quicker - reducing any potential delays
We ensure you gain the right insights and analytics to enable data-driven decision making ensuring you can easily identify when a project goes over budget or when there are delays in producing work
A dashboard is a visual display of important information or data that provides a quick and easy way to understand complex data or trends. Dashboards are typically used in business and data analytics to display key performance indicators (KPIs), metrics, and other data points that allow users to monitor the health of a system or process.Dashboards can take many forms, but they typically consist of graphs, charts, tables, and other visualisations that help users quickly identify trends, patterns, and outliers. They can be customised to fit the specific needs of the user or organisation and can be accessed through a web interface or a mobile app.
A brand portal is a centralised platform used to manage and share a company's brand assets, including logos, images, videos, and other marketing materials. It provides a way for internal teams, external partners, and other stakeholders to access and use these assets in a consistent and effective manner. The brand portal dashboard displays metrics related to the usage and effectiveness of these assets, such as the number of downloads, views, and shares of marketing materials. It may also include data on brand sentiment, engagement, and awareness, as well as other key metrics related to marketing campaigns and initiatives.
Dashboards can provide a more efficient and streamlined way of accessing and analysing data ensuring you have live or near live data whereas with offline reports as soon as the data is extracted its out of date. Dashboards allow users to make faster and more informed decisions as a result
We'd love to hear from you if you have questions about our products or services.